


Google analytics is the best way to find out more about the people who view your website, how well they can understand it, and it can give a base to improve and optimise your sales. It is the most popular analytics tool used on the internet.
We know for a newcomer, google analytics can appear scary but understanding your Google Analytics is key to measuring how effective your website is. So we’ve put together some simple tips that will help get started your analytics.
Google Analytics Basics
Key Metrics
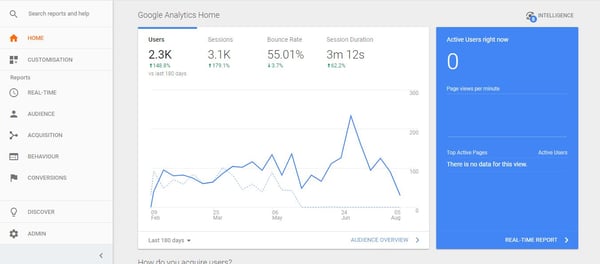
Once in your account, you’ll reach ‘Google Analytics Home’ with a main overview of your websites information. At the top of the page you’ll see the headers:
-
Users – the amount of people to use your site over that time period.
-
Sessions – the amount of times the site has been visited.
-
Bounce Rate – the percentage of people to visit your page and leave again without travelling through your website.
-
Session Duration – the average time spent on your site in one session.
These metrics can give you a good idea of how you’re performing at a glance. For example you want to have a high amount of users and sessions, that means a fair amount of people are on your website. However if you have a high bounce rate, it means you’re losing potential customers as they’re leaving your site almost immediately. You can investigate into this further by looking at your session duration which literally giver you the average minutes and seconds a user is on your site.
If you have a high bounce rate you should look into this further. What's causing them to leave your page so soon? It could be down to a number of factors including the design of your homepage being unattractive, confusing layout, or even that you haven't updated any of your content in a while.
Date Range
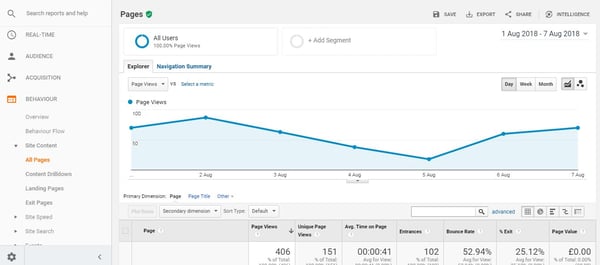
At the bottom of every main section there is a button that says ‘Last 7 days’ by clicking on this you can change the time period in which the information is coming from, for example ‘Last 30 days’ or ‘Last 90 days’. You also have an option to custom make a time period so if you need the information from the 16th June till the 7th September it's very simple.
Another important and helpful thing to take note of is that Google Analytics gives an option to compare time periods in this section, so you can compare this month’s reports to last month’s reports for an easy contrast and make adjustments and improvements accordingly.
Audience
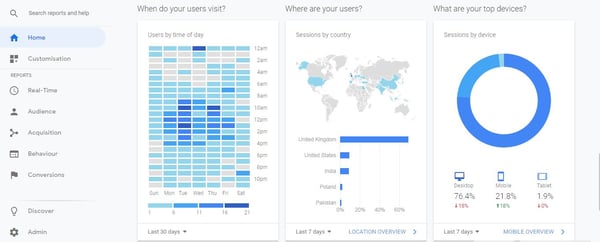
Your audience metrics are incredibly helpful when you’re looking into where your customers are and how they view your website.
When - A table showing which day of the week and time of day the user visited.
Where - A geographical location map of where your users are.
Top Devices - The percentage of users determined by which device they viewed your page on.
These analytics are useful as you can alter your ad settings to target people at certain times, specific areas and by device for the most profitable outcome.
Why is Analytics important?
In Google Analytics it gives you the opportunity to use the information to benefit your website directly. You can see what time of day your website receives the most traffic and where this is coming from. If you receive a lot more traffic from Facebook rather than twitter, then you know to spend more time being active there.
You can also see which of your posts are the most popular so you know to recreate content in a way that is well received by your customers. Example: if funny posts are performing better than serious one etc.
As well as this, there is an intelligence button near the top right hand corner where you can always ask questions that you need or want a quick answer to. For example, if you type “What states in the United States have the most users?” it will then show you.
What you should aim for:
-
High number of unique visitors
-
Spending more than two minutes on your website
-
Low bounce rate
Green arrows are always good .
And that’s it, all you need to know about the very basics of Google Analytics.